
A Personal Intrinsic Value Calculator:
- Sean Bartlett
- Feb 3, 2022
- 11 min read

“No matter how good a company is, it is not worth an infinite amount of dollars.”
-Charlie Munger
In this blog post, I will introduce an extremely conservative formula I made to value a business. First, I will explain what I generally consider when looking at a business, and then I will show a way to calculate what I perceive to be the absolute minimum a business is worth (granting that it already has strong fundamentals).
In order to figure out whether an investment has strong fundamentals, I must understand (1) the management, (2) the business’ wholistic image, (3) the profitability of the business, and lastly (4) its intrinsic value. In general, the management must be honest and personally invested into their own business i.e. there must be an incentive for the management to act in the best interest of the shareholders. The wholistic image concerns things like brand identity, competitive advantages, and other nontangible personal considerations the business can leverage against its competitors. The business’ profitability is found on their 10K financial statements and is an objective measurement.
When I keep a dossier of specific businesses, I use these fundamental considerations in a comparative and binary manner. Comparatively, I choose only the best company from a group of competing companies. When recording the above fundamental criteria, I will usually evaluate them in a binary as ‘good’ or ‘bad.’ For any company with a ‘bad’ mark, I won’t look any further in analyzing. For the ‘good’ businesses, I will add a short description of why I gave them a thumbs up. The final judgment in "close calls" is where the ‘art’ comes in. When it is not a close call, there is no art e.g. If a business is not profitable, then there will be no close calls and the business is obviously a no-go investment. There are some markers I look for as basic standards and once these standards are met, intuition and best judgement rule the day. To protect myself from faulty judgements, I introduce a margin of safety (discussed later) and a conservative approach.
The last criterium is the subject of this post. How do we value a company’s intrinsic value?
We need a formula for calculating a business' intrinsic value so that once we have a number, we can objectively see whether the business is selling at a fair price, a premium, or a discount. If the market price is below that number plus a margin of safety of say 30% (or more based on how safe we want to be, a typical number is 20%), then we can buy the business with reasonable assurance that we will make money the moment we buy it. I will usually increase this margin of safety if the fundamental judgements have close calls. We want to buy a company so cheap that even if our evaluation is wrong, we can still make money. The reason for this emphasis on safety is because I follow the tenet: “Do not lose money,” whether in the purchasing deal or in the form of risk from not knowing what business we are buying.
Note that a 20% loss in the value of a portfolio would requires a 25% subsequent gain to recover from that loss. A 90% loss in the value of a portfolio would require a 900% gain to recover that loss.
So then how do we value a company? There are a few methods that have been developed in graduate schools, by professors, or by other creative investors, but I will only use those valuations that I fully understand the limits to. For now, I will focus on the DCF model which was made popular by Warren Buffet. I will then talk about its limitations in the insurance industry and then offer an amended version I created due to this limitation. My amended version is exceedingly conservative and based on founding principles, otherwise I would not put any faith in it.
Before I explain these valuation methods, I have to explain why we buy a company to begin with. We invest money, by definition, to receive more money at a later date than we initially put in. If I pay 10$ for a share in a business, I expect to receive more than $10 in a predetermined amount of time. This return must either come in the form of business profits, or by (by luck!) an increase in value of the stock due to people randomly falling in love with the business. I will not base any strategies on the latter form of returns which fall into the realm of day-trading instead of investing. The decision to embark on an investment is then based upon what we expect to receive in profits by that investment. If we want to get money back one year from now rather than 10 years from now, we would want a company that gives good profits in one year compared to one that gives less profits in one year—even if the second company would provide more overall profits in, say, 10 years. For instance, a developed but slow growing business that produces a high rate of return in one year may be a better investment than Tesla which has a relatively low rate of return today but is expected to grow astronomically in 10 years.
So then we succeed by finding the right opportunities for our aims, and we succeed in analyzing companies just if we can find better investing opportunities. If we have 100 different businesses to invest in, we choose the one that gives us the most money back given a predetermined set of time. The more businesses we analyze, the more potential we have for finding profitable businesses.
We want companies that produce a lot of profits then, but specifically only those companies whose profits find their way into our pocket books. Some companies do a terrible job reinvesting their profits such that even when they receive 10% profits from their operations, we only see about 1% in our pockets by means of dividend payments or stock increases. In a case like this, an honest company would be better off giving its shareholders all of the 10% in dividends since we would be better off using that money to invest in other instruments such as 2% T-notes or the U.S. stock market---which holds a historical average of 8%. For a real example, Berkshire Hathaway's See’s Candies provides consistent profits, but it has little in the way of expansion potential. For this reason, Berkshire Hathaway uses See’s Candies’ profits to invest in its other companies such as Geico Insurance or Coca-Cola. If you can only turn $1 into $1.01 in the course of a year, then wouldn't you be better off using that $1 to turn into $1.02 through stable government T-notes? Of course you would. Unfortunately some companies still reinvest their profits at horrible rates because they have other egotistical agendas in mind, like trying to build an empire at all costs, even to their own financial detriment. That's a business you'd want to stay away from, not in the least because it hints at dishonest business practices.
So now that we are on the same page about investing, I can explain where the Discounted Cashflow (DCF) Model comes from. It is a valuation formula calculating the total amount of cash the company is expected to receive from its primary operations each year minus any cash used to keep the company operating (capital expenditures). This number is called "free cashflow" and it represents the “owner's earnings” or the amount of money that should go into the pockets of the owners. It finds its way into the owner's pockets through dividends, or through increased value in the business from reinvestments. For instance, if we own a business that produces $1000 in profits, that profit could be given to us through a direct payment in the form of a dividend, or alternatively through the buying a new machine that costs $1000. That new machine is an asset that we still own (increasing the value of the business), and the reason we bought it is because we believe this machine will give a return on that $1000 in a greater amount than if we were to just pocket the dividend and find another investment. If that machine will give $100 in profits next year, and the next best investment would only give us $50 next year, aren't we glad that we have that machine? Not only that, but the increased value in the business will at some point enter our pockets the moment we sell the business.
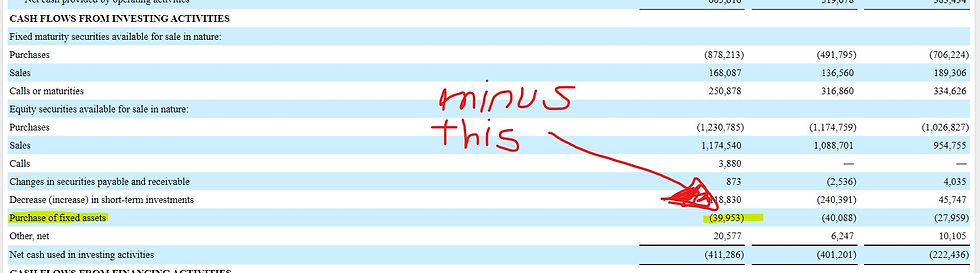
Free Cash Flow then is the total cash received from primary operations minus any overhead expenses that would be required to keep these operations continuing. This overhead, or capital expenditures, usually includes depreciation, machinery, factory leases, employment wages etc. The remaining value is called the Free Cash Flow or “owners earnings” because it is theoretically what the shareholders should see in their pockets—through dividends, or stock price increases (caused by reinvestments of those profits into assets that would expand the company’s future profits). Free Cash Flow looks like this on the cashflow statement on a business’s 10K (This is the 2020 cashflow statement from Mercury General Corporation):

After we calculate the expected owner's earnings for the next 10 years, we then have to discount those future dollars to account for time. The idea is that $10 now is worth less than $10 in the future. The reason being that you can theoretically turn $10 into $12 in a couple years, not to mention inflation which reduces future money values as well. Because the discount value accounts for the value you could get from other investments, it thus sets the opportunity cost of your investments. Why would you purchase a company that gives you an 8% gain on your investment each year when you are certain there are other opportunities granting you a 10% gain each year. In this scenario, we would use 10% as the discount rate.
You aggregate the expected “owner’s earnings” for the next 10 years discounting each year. At the end, you add the expected price of selling the business at the end of the term (again discounted by the year it would be sold). This number is the total dollar value you would expect to receive from that investment and thus the present value of the company.
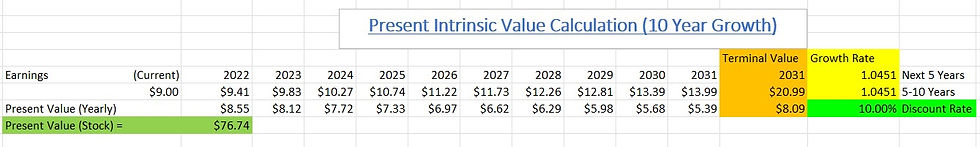
This is a DCF model calculator where we input conservative values for the Free Cash Flow and its expected growth each year. Also a discount rate. The bottom number, $76.74 under the heading "Present Value (Stock)" is the theoretic intrinsic value of the business: MCY as of writing this is selling for $52.97 a share.
[Thanks to Cooper Academy on YouTube for the excel sheet https://www.youtube.com/watch?v=d0EBO-vs0GM&t=508s]
However, any valuation must involve a margin of safety because predictions have a tendency towards be wrong. Another way to account for error is by choosing conservative Inputs when extrapolating the future earnings growth or when deciding the cashflow input for the formula. The financial statements you read may present an abnormally good or bad year which would ruin your evaluations. Not only that, but companies have in the past manipulated their accounting practices to make it seem like they are doing better or worse than they actually are (Cashflow statements are harder to manipulate, though not impossible, and that is why we use them rather than “net income from operations” when calculating Intrinsic values).
The DCF model makes sense, and that is why people use it, but depending on the type of business you are evaluating, it may need some updating. Businesses are complex, and to accommodate this complexity no one standard should apply to all. When creating new models, especially when financial wellbeing is on the line, we must take care to use a conservative approach and only accept new models if they are more conservative or are backed by an extremely sound rational.
In this spirit, I created a new valuation model that I think better captures the financials of insurance companies, and in general a better foundation for all companies because it is so safe. The problem that I ran into with the DCF model is that, in the case of insurance companies, it produces valuations that are way above the market prices of insurance companies since they function with very little overhead. As we can see from the above illustration, the DCF model shows a clear buy signal for MCY with a margin of safety exceeding 30%. However, it shows the same results for other insurance companies and at various points in their historical trends even when these companies consistently failed to produce the profits that they were expected to produce. (I can back this up in length with various figure and illustrations of many insurance companies. Maybe I should? If someone could leave feedback if the extra effort on my part to show this would help)
The reason for the discrepancy between the DCF valuation model and the actual results is due to the strange nature of how capital expenditures is calculated for insurance businesses. The cost to keep them running is very low, i.e. they don’t use equipment or factories to produce goods, and so their free cashflows tends to be more than should be accounted for. What they do instead is produce income from both premiums and investments from those premiums (plus investments on their assets). Because they make an income from money itself, it is hard to account for the amount of overhead that is needed to produce consistent profits. They don’t use factories or equipment but instead use wealth itself as those factories and equipment to produce income. Also their investment gains and losses can sway as the general market moves up and down. These variables make it hard to study their free cashflow statements because cash that they receive from income is put back into their business in the form of investments, not in order to expand but in order to simply keep the business profitable. Owners’ earnings only increases when the book value of the company increases or when they pay out a dividend.
When using the DCF model, all four insurance businesses I evaluated would show clear buy signals and yet fail to produce the expected results. Through careful analysis, I found that each of the four insurance businesses rarely deviate from the1.5 price to book value we currently see today and that even historical records suggest that the price of such businesses rarely deviated from that ratio. If the DCF model is correct in these cases, then we would see a price to book value increase in the future, or else see a proportional book value increase with the amount of free cash flow minus any dividends. This doesn't happen however.
Thus, I updated the DCF model to include as owner's earnings only those dividends and book value increases instead of free cashflow which gave unjustly large company evaluations in the insurance industry. Since the stock prices have historically increased in proportion to book values at a multiple of 1.5, I calculate the owner’s earnings by only with dividends and the increase in book value. This has the benefit of being a more conservative model based on a basic principles approach. It is more accurately indicative of the “owner’s earning” when backtracked 10 years for each of the insurance businesses.
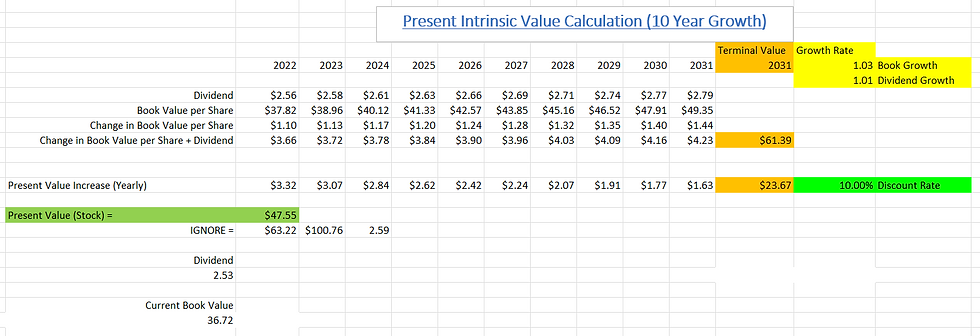
The inputs in this updated DCF model include only dividend and current book value rather than the free cashflow. We still have a discount rate and the expected growth rates of dividends and book values. As we can see, the calculated price is $47.55 which indicates that the current stock price of $52.97 is slightly overpriced at a discount opportunity cost of 10%. My inputs were selected based off of conservative estimates.
Book value is a good guide because book value indicates the value of the tangible assets a company owns and does not owe as debt—for instance, if the stock price is $30 per share and the book value per share is $36, this represents a price to book value per share below one. At this level, we can theoretically buy the entire company and immediately sell it off and still make a profit by liquidating its assets. There is a reason why book value correlates to share price and it practically functions as the bottom floor that the share price rarely goes below. If book value increases, the company holds more wealth in terms of buildings, equipment, cash, and securities. So it is a very useful and conservative measurement of the increase in wealth that a company gains from profits.
I have found that through this method, none of the four insurance companies I analyzed indicate a buy signal today in the manner that would produce returns greater than 10% in a given amount of time. However, because they are all companies that are valued based on dividends and book value rather than speculation on their future prospects, they represent safe investments for those who are weary of a fluctuating market.
Note:
My models did not take into account the reinvestments of dividends which would make my intrinsic value calculation higher. I could input this into my formula, but it would only serve to increase my valuations. I am trying to spend my time searching for bargains rather than companies that would barely meet my threshold of a "good investment."
Comments